Network Diagram is the most interesting concept in project scheduling. But, it can also become tricky if you do not understand it clearly. Today, I got a query from one of my PMP candidates. He sent me the following table of activities.
He was confused why activity E is appearing twice in the table with different duration. He also wanted to know the critical path, duration of the critical path and the total float of activity B.
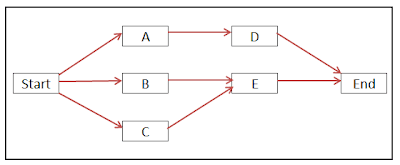
So, we have no problem in drawing the network. You can check the relationship against the table and everything looks fine.
Now, let us start including the duration for each activity. This is where it gets troublesome. Activity E's duration is shown as 5 days in one row and as 6 days in another. Why does activity E appears twice with different duration?
Since activity E appears twice, this problem cannot be represented using Precedence Diagramming Method (PDM)/ Activity On Node (AON) diagram or even Arrow Diagramming Method (ADM)/ Activity On Arrow (AOA) diagram. In both approaches, the activity appears only once. So, we need to interpret the problem a little bit differently.
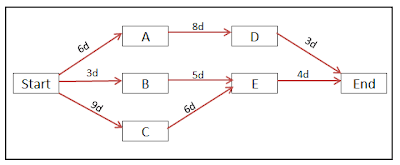
Instead of reading that duration of activity E is 5 days, let us read it as the duration of activity E-B is 5 days. Similarly, let us interpret that the duration of E-C is 6 days. With this interpretation, I am going to draw the network with a combination of both PDM and ADM. The activity is placed in the node as in PDM while the duration is placed on the arrow as in ADM. Let us see how the network diagram looks like.
So, I believe we have correctly represented the problem in the network diagram. Now, it is simple to answer the questions.
Question 1: Identify the Critical Path. What is the duration of the critical path?
We have three paths in the network, namely Start-A-D-End, Start-B-E-End and Start-C-E-End. Let us find out the duration of each path.
Duration of Start-A-D-End: 17 days
Duration of Start-B-E-End: 12 days
Duration of Start-C-E-End: 19 days
So, it is clear that the path Start-C-E-End with the longest duration of 19 days is the critical path.
Question 2: What is the total float of activity B?
We know the duration of the critical path is 19 days. Activity B appears in only one path, Start-B-E-End, which takes 12 days. So, the total float of activity B is 19-12 = 7 days.
That's it. Hope the above explanation gives you a better picture of the problem and its solution. What is your opinion? Is it clear? Do you have any other doubts? Please feel free to leave your comments.
| Activity | Predecessor | Duration (days) |
|---|---|---|
| A | Start | 6 |
| D | A | 8 |
| B | Start | 3 |
| E | B | 5 |
| C | Start | 9 |
| E | C | 6 |
| End | D | 3 |
| End | E | 4 |
He was confused why activity E is appearing twice in the table with different duration. He also wanted to know the critical path, duration of the critical path and the total float of activity B.
Solution
Now, let us look at the solution for the above problem. I will draw the network diagram using Precedence Diagramming Method (PDM)/ Activity On Node (AON) diagram. To avoid confusion, I will just draw the relationship without showing the duration of the activities.So, we have no problem in drawing the network. You can check the relationship against the table and everything looks fine.
Now, let us start including the duration for each activity. This is where it gets troublesome. Activity E's duration is shown as 5 days in one row and as 6 days in another. Why does activity E appears twice with different duration?
You may also be interested in:
Since activity E appears twice, this problem cannot be represented using Precedence Diagramming Method (PDM)/ Activity On Node (AON) diagram or even Arrow Diagramming Method (ADM)/ Activity On Arrow (AOA) diagram. In both approaches, the activity appears only once. So, we need to interpret the problem a little bit differently.
Instead of reading that duration of activity E is 5 days, let us read it as the duration of activity E-B is 5 days. Similarly, let us interpret that the duration of E-C is 6 days. With this interpretation, I am going to draw the network with a combination of both PDM and ADM. The activity is placed in the node as in PDM while the duration is placed on the arrow as in ADM. Let us see how the network diagram looks like.
So, I believe we have correctly represented the problem in the network diagram. Now, it is simple to answer the questions.
Question 1: Identify the Critical Path. What is the duration of the critical path?
We have three paths in the network, namely Start-A-D-End, Start-B-E-End and Start-C-E-End. Let us find out the duration of each path.
Duration of Start-A-D-End: 17 days
Duration of Start-B-E-End: 12 days
Duration of Start-C-E-End: 19 days
So, it is clear that the path Start-C-E-End with the longest duration of 19 days is the critical path.
Question 2: What is the total float of activity B?
We know the duration of the critical path is 19 days. Activity B appears in only one path, Start-B-E-End, which takes 12 days. So, the total float of activity B is 19-12 = 7 days.
That's it. Hope the above explanation gives you a better picture of the problem and its solution. What is your opinion? Is it clear? Do you have any other doubts? Please feel free to leave your comments.


0 comments:
Post a Comment