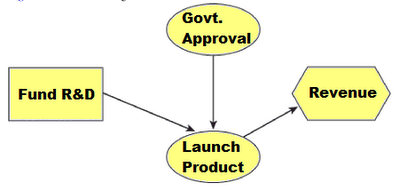
Diagramming Techniques are used to identify risks in a project. Some of the diagramming techniques that are included in PMBOK/ PMP are Cause and effect diagram, System or process flow charts and influence diagrams.
Cause and effect diagram
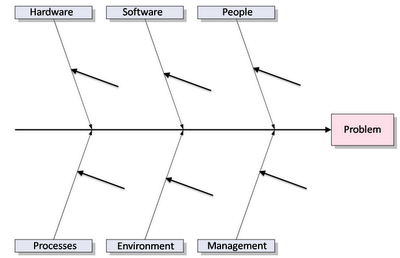
This diagram is also known as Ishikawa diagram or Fish-bone diagram. It is referred to as the "Ishikawa diagram" because Dr. Kaoru Ishikawa, a Japanese quality control statistician, developed this diagram. The name "fishbone diagram" is derived from the fact that the entire diagram resembles a fish skeleton. The diagram illustrates the main causes and sub causes leading to an effect. It is used to identify potential root causes to problems.You may also be interested in:
System or process flow charts
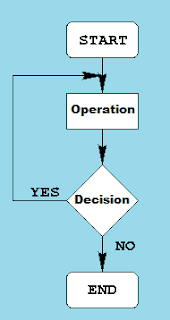
System flow charts are very helpful to show how various elements of a system interrelate. They can be used to analyze an entire process by following the logical steps leading to an outcome or an objective. Flow charts are acclaimed for their ability to identify bottlenecks and superfluous processes.You may also be interested in:


Thanks for the list of diagrams here. I also want to add a note.
ReplyThe Ishikawa diagram is mainly mentioned as a quality control tool used during the planning phase. But the idea can be easily implemented to other areas like risk management as told in this guide
Thanks Eralper for your comment.